Social Network Structure of Network Neutrality
Data Collection
The data set consists of a convenience sample produced by using high-search ranked websites to seed multiple snowball samples. Individuals, corporations, non-profits, websites, associations, coalitions and government entities are treated as unitary actors and coded as ‘nodes’. Any membership or collaborative correspondence is treated a relationship and coded as an ‘edge’. During the data cleaning process, attempts are made to standardize names of organizations. It is assumed that subsidiaries share the policy preferences of their corporate parents, and are therefore re-named after the parent company (i.e. AT&T Canada Inc became AT&T). The data set consisting of 9916 edges for 3953 nodes can be downloaded http://www.sfu.ca/~jkm9/neutralnet/data_all.txt.
The data set includes members of coalitions like SaveTheInternet.com, the Open Internet Coalition, SaveOurNet.ca, HandsOffTheInternet.com and NetCompetition.org, as well as members of connected industry organizations including the National Association of Manufacturers, CATA Alliance, the Information Technology Association of America and the Canadian Association of Internet Providers. Where relevant documents could be identified, the data set includes co-signers to open letters, amicus briefs, whitepapers and advisory reports to the U.S. Federal Communications Commission and the Canadian Radio-Television and Telecommunications Commission. When the boards of directors and senior staff of NGOs and industry associations are immediately available, they are included in the data set, though the board members of corporations are not.
Exploring the Data
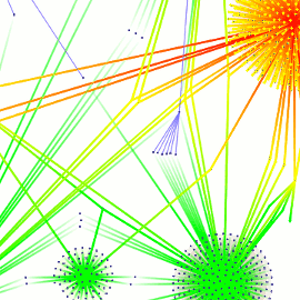
The data set exhibits the characteristics of a power law graph in which the top 8% most connected nodes account for 50% of all edges, and the top 0.5% most connected nodes account for 38% of all edges. Figure 1, which graphs the top 100 most connected nodes, (44% of all edges) illustrates the phenomenon.
Less than 200 nodes have 3 or more edges and fewer than 1500 of the nodes have 2 or more edges. Over half of the organizations in the data set are ‘leaf nodes’ which have only one edge and connect to only one other node. Table 1 lists the top 45 most-connected nodes, and includes many of the largest coalitions in the net neutrality debates as well as many of the most influential NGOs and largest corporations. There is clearly an influence of researcher bias in this data, as many of the search seeds are highly represented, including neutrality.ca, SaveTheInternet.com, the Open Internet Coalition and others. However, many high-ranking rank individuals and organizations are present because they are genuinely well connected, including the Free Press, Union des consommateurs, Rogers, Accenture, Deloitte & Touche and Andre Delattre.
Visualizing the Network Structure
Visualization of the data sets was produced with SemaSpace, a platform-independent, java based, dynamic network graph plotter “specially designed for the fast, interactive manipulation of very large networks” (Offenhuber & Dirmoser, 2008). Initial graphing of the full data set, which includes edges to government agencies like the FCC and CRTC, revealed the complexity of network neutrality lobbying efforts but obscured inter-actor relationships by treating government agencies as allies of the lobbying entities. The data set was consequently segregated into six ego-centric networks centred on high ranked and high-interest nodes, and consisting of all edges and nodes which connect at one degree. All six of these networks were loaded into SemaSpace and manually arranged to clarify similar linkages.