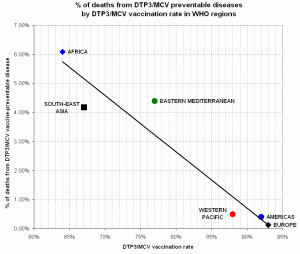
In a recent post entitled “Open letter to anti-vaccinationists“, at the Disease of the Week blog, immunology researcher Thomas Tu sought to open dialogue by telling his personal story. Based on Tu’s premise that with vaccination opponents are rational and reasonable, and in recognition of the movement’s emphasis on doing one’s own research, this post investigates the relationship between vaccination rates and disease-related death rates. It is written in such a way that any layperson should be able to recreate the results themselves.
To make things consistent and a little easier for ourselves, the six geographical regions as defined by the World Health Organization (WHO) regions: Africa, the Americas, Eastern Mediterranean, Europe, South-East Asia and the Western Pacific. The independent variable (X) is the percentage of the population (in 2004) vaccinated with DTP3 and MCV; the dependent variable (Y) is the proportion of deaths, in 2004, caused by the four diseases for which these vaccines provide immunity: diphtheria, pertussis, tetanus (DTP3), and meningitis (MCV).
Our data sources:
- DTP3 and MCV vaccination rates are from the 2004 columns of the two tables on p. xiii of 2010 edition of Immunization Summary: A statistical reference containing data through 2008, published by WHO/UNICEF. URL: http://www.childinfo.org/files/Immunization_Summary_2008_r6.pdf
- Deaths for diseases vaccinated against by DTP3 and MCV come from the Deaths by WHO regions(xls) table of WHO’s Disease and injury regional estimates for 2004.
The vaccination rates for DTP3 and MCV are identical for all regions, so we’ll assume that receiving one vaccination implies receiving the other and combine them into one column. For each region, the sum of rows 17, 18, 19 and 22 (in source 2) is the number of thousands of deaths attributed to DTP3 and MCV-preventable diseases. That value, divided by the total number of deaths per region (row 6), provides the vaccine-preventable deaths as a proportion of total mortality, which we’ll add as a second column. (A very convincing argument could be made that this proportion under-estimates the impact of other developmental conditions but we can proceed regardless. [footnote 1])
Place the DTP/MCV vaccination rates and vaccine-preventable deaths into a spreadsheet table like so:
| vaccination rate | diseases as % of total deaths | |
| Africa | 64% | 6.09% |
| Americas | 92% | 0.40% |
| Eastern Mediterranean | 77% | 4.39% |
| Europe | 93% | 0.13% |
| South-East Asia | 67% | 4.18% |
| Western Pacific | 88% | 0.49% |
…and graph the result with a best-fit line.

I think the table’s pretty easy to read: the higher the vaccination rate, the lower the proportion of deaths caused by the disease. If you run some statistics [?] on your table, you’ll find that the correlation coefficient [?], which ranges from -1.0 and +1.0, reports a very strong negative correlation (r=-0.9568) which is extremely unlikely (p<0.0001 [?]). The coefficient of determination tells us that 91.5% of the variation in death from diphtheria, pertussis, tetanus and meningitis can be explained by vaccination rates.
When someone makes the decision whether or not to vaccinate a child, this is the big picture. By opting-out we lower the vaccination rate which, in aggregate, will likely result in more deaths from preventable diseases. We routinely see outbreaks of diphtheria, pertussis, tetanus and meningitis in communities where vaccination rates have fallen.
Most of the “vaccines cause autism” talk regards the MMR vaccine for measles, mumps and rubella. We didn’t run statistics on measles because because vaccines have so reduced the number of deaths in Europe (344) and North America (4) that they don’t even register on the WHO tables. We have seen outbreaks of measles, mumps and rubella in Europe and North America, however, whenever MMR vaccination and/or booster rates have fallen. During the same the period, the Measles Initiative managed to reduce measles mortality in Africa by 91% and increase vaccination rates from 56% to 73% (2007 Annual Report).
Our findings above might suggest this is not a coincidence.
[1] That vaccination rates track with other socioeconomic factors indicators, including income, education, and access to health care is reflected in the data: An African is 900 times more likely to die of nutritional deficiencies than a European, and 340 times more likely to die of Tuberculosis (which is treatable). The vast majority of deaths in Europe (85.7%) and the Americas (76.9%) are attributable to noncommunicable conditions like cardiovascular disease (43.0%) and malignant cancers (19.4%), while infectious and parasitic diseases account for 42.1% of deaths in Africa. This is, however, exactly the point: An African is five times less likely to die of cardiovascular disease, compared to a European, precisely because they are 1800 times more likely to die of an infectious disease and 2300 times more likely to die of vaccine-preventable disease. For comparison, an African is 150 times more likely to die of violence related to crime, assault, war or civil conflict (1.9% of total deaths) than a European (0.79%).